
What is Microsoft Excel ?
Hi everyone, today I will give some review about Microsoft Excel as a learning tool. In Microsoft Excel, many of people can applied the benefits that it has in many section and areas including teacher and student. Excel is contain with many useful techniques that we never think before if we not explore it. In my opinion, using this application as a learning tools will save our time in calculation whether in a simple or complex calculation for teachers also for a student . Moreover, it also is an up-to-date application with new features and being use for so many years.We also can even work on Microsoft Excel using mobile phone if we don't have laptop Besides, it also provide security to our files so that no one else can see our files or ruin them. With the help of Microsoft Excel, we can keep our files password protected.
Microsoft Excel is a spreadsheet program included in the Microsoft Office suite of applications. Spreadsheet present tables of values arrange in rows and columns that can be manipulated mathematically using both basic and complex arithmetic operations and functions. The basic layout of computerized spreadsheet is the same as the paper one. Related data is stored in tables which are a collection of small rectangular boxes or cell which then organized into rows and columns. Hence, it is used to create grid of text, numbers and formula specifying calculations. It can be programmed to pull in data from external resources and automatically running data through formula such as financial models. This financial models is to update information in real time and perform various calculations. Microsoft Excel also has numerous tools and features that make on's work easy. Hence it is very suitable as medium of learning tools toward student and teachers.
Features of Microsoft Excel

How Excel Works?
An Excel document is called a workbook. A workbook always has at least one worksheet. Worksheet are grid where you can store and calculate data. You can have many worksheets store in a workbook and each of it with a unique worksheet name.
Worksheet are laid out in columns (vertical) and rows (horizontal). The intersection of any given row and column is a cell. Cells are really were you enter any information. A cell will accept a large amount of text, date number or formula. Each cell can be formatted individually with distinct border, background color and font size/type/color.
Worksheet are laid out in columns (vertical) and rows (horizontal). The intersection of any given row and column is a cell. Cells are really were you enter any information. A cell will accept a large amount of text, date number or formula. Each cell can be formatted individually with distinct border, background color and font size/type/color.
Excel Formula
You can create simple and complex formula in Excel to calculate anything. Inputs to a formula may be other cells, the results of other formula or just straight-forward math (7+6*5). Excel includes a formula library for calculating things like Net Present Value (NPV), Standard Deviation , interest payment over time, other common financial and mathematics formula. Excel formula bar includes a feature to help you search for a formula you need and also helps you select the appropriate cells in your workbook to calculate the formula.
Excel Alternatives
:max_bytes(150000):strip_icc():format(webp)/TCSQ1-5a690c6b3418c6001912517e.jpg)
Other current spreadsheet program that are available for use include:
Google Sheets (or Google Spreadsheets) - a free web based spreadsheet program.
Excel Online - a free, scaled-down , web based version of Excel.
Spreadsheet Cells and Cell References
:max_bytes(150000):strip_icc():format(webp)/RowsandColumns-5a690dd96edd650037ee83cd.jpg)
When you look at the Excel screen or any other spreadsheet screen, you will see a rectangular table or a grid of row and column as shown in the image above.
In newer version of Excel, each worksheet contains roughly a million rows and more than 16 000 column which necessitates an addressing scheme in order to keep track of where data is located.
The horizontal rows are identified by numbers (1, 2, 3) and the vertical columns by letters of alphabet (A, B, C). For columns beyond 26, column are identified by two or more letters such as AA, AB, AC or AAA , AAB and many more.
The intersection point between a column and a row as mentioned is the small rectangular box known as a cell.The cell is the basic unit for storing data in the worksheet because each worksheet contains millions of these cells and each one is identified by its cell reference.
A cell reference is a combination of the column letter and the row number such as A3,B6 and AA345. In these cell references, the column letter is always listed first.
Data Types, Formula and Functions
:max_bytes(150000):strip_icc():format(webp)/Formula-5a690e6d1f4e130039a7d806.jpg)
The types of data that a cell can hold include:
- Numbers
- Text
- Data and times
- Boolean values
- Formula
Formula are used for calculations, usually incorporating data contained in other cells. These cells may be located on different worksheets or workbooks.
Creating formula starts by entering the equal sign in the cell where you want the answer displayed. Formula can also include cell references to the location of data and one or more spreadsheet functions.
Functions in Excel and other electronic spreadsheets are built-in formula that are designed to simplify carrying out a wide range of calculation from common operations such as entering the data or time to more complex ones such as finding specific information located in large tables of data.
Excel Charting
:max_bytes(150000):strip_icc():format(webp)/Charttools-5a690f77c673350019bb304b.jpg)
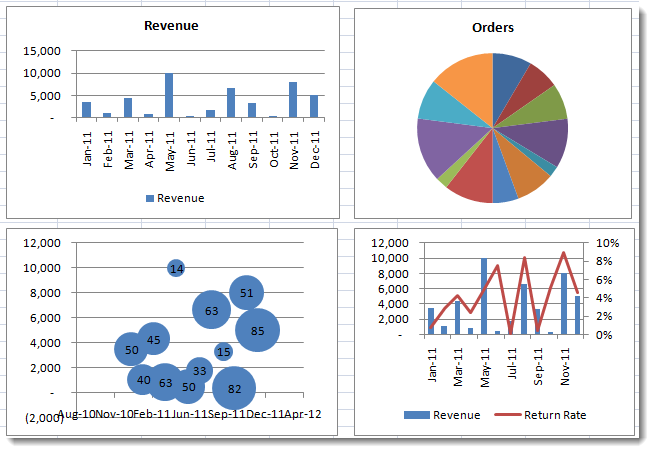
Graphing or charting data - identifying data trends. Excel offers a wide array of charts to visualize data. They range from simple line graphs to bubble and radar chart. Excel has two main tools for charting which are
- Standard Chart- relatively static once you create it. As you change data in your spreadsheet, related cell will refresh the chart to show the new updates.
 |
| Standard Microsoft Excel Chart |
- Pivot Chart - more dynamic , allowing you to slice and dice your data in several different way by choosing which column contain the information you want to group by or apply mathematical operations (sum, count, average, find maximum)
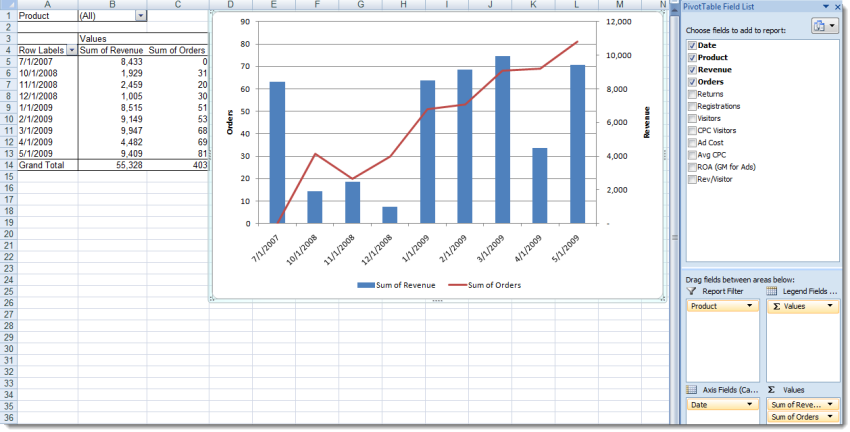
Excel Pivot Table and Pivot
Excel Tools
There are a lot of tools that make work extremely easy. There are tools for sorting, filtering and searching. If we combine these tools with tables and pivot table or others, then we will be able to finish our work in much less time. Multiple elements can be search easily from large amount of data to help solve a lot of problems and questions.
Restore lost or damage file
If your data get lost, then you can recover it without much inconvenience and not worry as with the new Microsoft Excel XML format we can restore the lost or damage file data
Solve Mathematics Problem
It make easy for us to solve mathematics problem even in a complex one in a much simpler way without much manual effort. There are many formula in Microsoft Excel and by using these formula we can implement lots of operations such as finding sum, average and many more on large amount of data all at once.
Provide Security
People can keep their data or files safe because they can keep the file with password-protected through visual basic programming or directly within the excel file. People store their important data so that they can keep their data in an organize way and save their time as well.
Access Online
It can be access online from anywhere and everywhere which means that you can access it from any device and any location whenever you want. It provides the facility of working conveniently which means if you don't have laptop then you can use your mobile phone and do work easily without any problem.
Keep Data in One Location
You can keep all your data at one location. This will help you in saving your data from getting lost. It will keep all your data in one place and you will not waste your time in searching for the files. You can look up the categorized and sorted data easily. The saved computer file is often referred to as a workbook and each page in the workbook is a separate worksheets.

Large Amount of Data
You can store a large amount of data in the Microsoft Excel and analyze it as well. It helps in keeping the data combined in one place so that data does not get lost and one does not waste their time in finding a particular data.
Shortcut keys for Excel
Benefits of Excel in Learning

- Help students manage working with complex sets of numbers and save time by allowing for quick calculations.
- Increase student motivation because they can manipulate spreadsheet graphics.
- Layout students' data. Designed to provide an in depth insight into all student data. It also allows you to layout your text data in spreadsheet workbook format.These workbook can be used to bring information and data from various files and locations to a single destination for them to be crunched and analysed on a single file.
- Easy to reformat and rearrange data. It is easy to format using different color shades,bold,italics to bring the most important data to the force.Extremely useful when presenting an array of different numbers relevant to the same topic.
- Identify and analyse trends and patterns in large amount of data. It is easy to identify and analyse patterns in your data spreading up to one millions rows and 16 000 columns.
- Conditional formatting. It helps to change formatting of a cell,based on the information contained.
- Sharing and Connectivity. It allows you to to shared and collaborate with others members of your project or friends group through Share Point, or One Drive. Everyone can sending the link to the same file and once you are already save it, you and another member can work together on it in a real time.
Benefits of Excel in Teaching

- Increase the breadth of course content. More sophisticated topics become in reach for lower-level courses.For example,models described by systems of equations with no standard algebraic solution can be explored through numerical example when the spreadsheet program is used to solve the system numerically.
- Increase the depth of course content. Sometimes data sets are too large or models are too complicated to allow significant exploration. Using spreadsheet, it allow for variety of scenarios to be explored quickly so student can get a better intuitive sense of how a model works or what a data series shows.
- Improve critical thinking skills.
- Improve quantitative literacy. Any course that use table of data , equations and graphs or make any arguments based on quantitative information provides an opportunity for students to enhance fluency in quantitative method.
- Improve assessment. At first, it may seems that giving students access to computers complicates assessment, in fact it make it easier to judge learning and assign grades in some context.
How to start with Microsoft Excel?
- Firstly, you need to install Microsoft Office which have Microsoft Excel Application.
- Then, you just need to open it and start with your assignment by using it.
As a student, I also using this spreadsheet to make a calculation . However, we usually make a complex calculation that related with statistic 2.In Statistic , we also can make a complex calculation such as Analysis of Variance (ANOVA) by using a spreadsheet rather than doing it manually. Hence, it also will save my time.
How to make a calculation of ANOVA ?

- Open the Microsoft Excel
- Open file option then choose Add-Ins and choose Analysis Toolpark

- Insert the data given which is question given in the statistic to solve the problem

- Then go to Data in the ribbon and choose Data Analysis

- In Data Analysis , choose ANOVA Single Factor

- The highlight all the data that is needed in the calculation in Input Range,while in Output Range choose any cell that suitable to present the data later or the result. Then click ok.


 |
| The result of Anova: Single Factor will be calculated. |
Lastly, we can check our manual calculation and the given result of the question given by comparison
SSTreat - Sum of Square Treatment = 85435.1
SSE - Sum of Square Error = 124678
SST - Sum of Square Total = 210113
Ftest - Means Square Treatment = 4.28279
MSE - Mean Square Error = 4987.11
Fcritical - Find the critical region = 2.76
How to make a Gradebook?
Other than that, student or teacher also can make a gradebook or calculate their student marks with a large number of student just by using a spreadsheet. It also will saving your time and easy to use. here is a preface of a gradebook.

Here is the list of marks the student get:-

Hence, we need to calculate the marks based on the weighting given which is assignment 1 ( 10%) assignment 2 (20%) , test 1(30%) and final(40%).Here is the result after calculating the marks based on excel formula.

Here is some formula to calculate the marks.

Video of automate rounding off
Video on calculating weighted grade
The best excel online courses if you want to learn Excel through online resources are :-
Last but not least,spreadsheet are the original "killer apps" for personal computer because of their ability to compile and make sense of information. Besides, there are a lot of benefit of using this Microsoft Excel which is why it is used by worldwide people for performing so many task. It is not only save times but also it make work easier. It can almost perform every type of task such as mathematical calculation and a gradebook. Hence, it has give a lot of benefit as a learning tools without we even realize it just we need to explore more about this precious application so that it can be used to give others a benefit too. Thank you.

No comments:
Post a Comment